
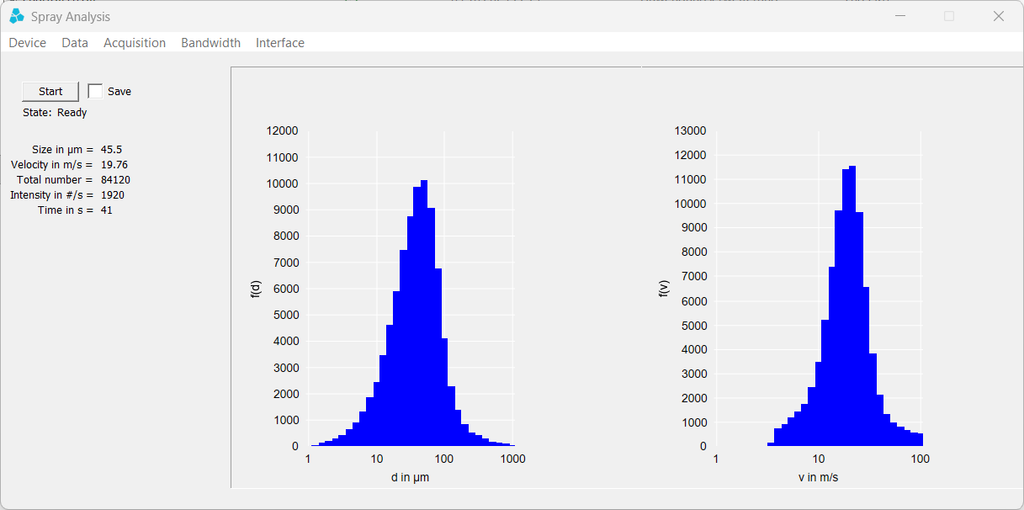
SprayQuantAI® Analysis is software for evaluating droplet measurements. It displays key measurement values together with droplet-size and velocity distributions, helping users analyse the characteristics of a measured spray.
Droplet Size and Velocity Distributions
The software displays histograms for droplet diameter and velocity. The size distribution is plotted as f(d) against droplet diameter in micrometres. The velocity distribution is plotted as f(v) against velocity in metres per second.
These plots show how the measured droplets are distributed across different size and velocity ranges.
Measurement Values at a Glance
The analysis window presents measurement values alongside the distribution plots. The screenshot shows the following fields:
- droplet size in µm
- velocity in m/s
- total number of detected droplets
- intensity in droplets per second
- measurement time in seconds
The displayed values describe the current measurement and depend on the measurement conditions and selected configuration.
Measurement Setup and Controls
The interface includes menus for Device, Data, Acquisition, Bandwidth and Interface settings. A Start control begins the measurement, while a Save option is available for recording data. The software also displays its current state, such as “Ready”.
The available settings and functions depend on the connected SprayQuantAI® system and its configuration.
Spray Analysis and Spray Monitoring
Spray Analysis focuses on droplet-size and velocity distributions, together with measurement summary values. Spray Monitor, by comparison, displays measurement values as time-dependent graphs for observing changes during a process.
Together, the two software tools support different views of SprayQuantAI® measurement data: distribution analysis and time-resolved monitoring.