
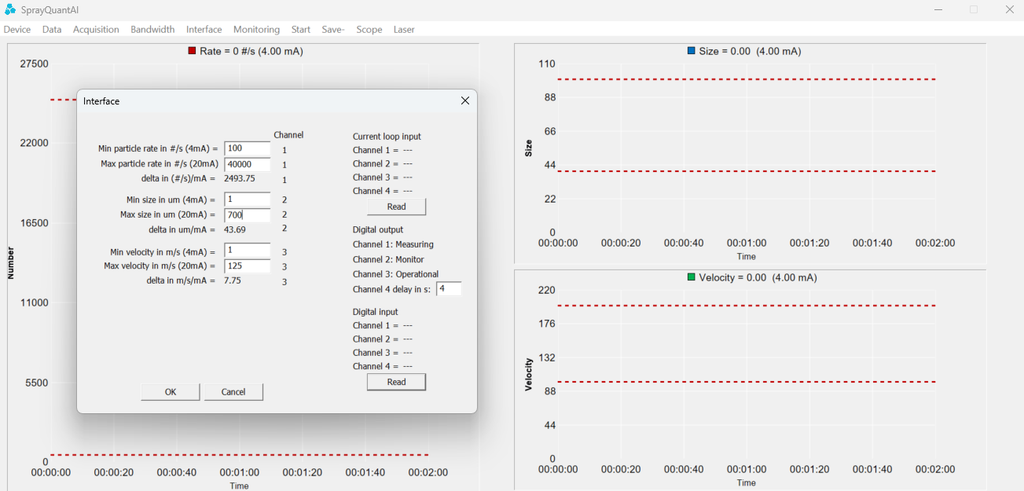
SprayQuantAI® Monitor is the software for operating and monitoring SprayQuantAI® measurements. Version 2.0.0 connects a Windows computer to the processing unit via Ethernet, displays measurement data in real time and stores results for later evaluation.
The processing unit calculates the droplet properties. SprayQuantAI® Monitor provides the device connection, measurement configuration, graphical display and data storage.
Live Spray Monitoring
During measurement, the software displays three graphs over time:
- droplet size
- droplet velocity
- droplet number within the selected integration time
The displayed values are averaged over the selected integration time. A shorter integration time shows changes more quickly, while a longer integration time produces smoother mean values.
Measurement Configuration
The software provides four menus for configuring and managing a measurement:
- Device: enter the processing unit’s IP address and test the Ethernet connection.
- Data: select the measurement file and storage location, and choose or transfer a configuration file.
- Acquisition: set data acquisition parameters, including the integration time.
- Bandwidth: adjust the measurement range.
Acquisition and bandwidth settings are intended for advanced use. Changes to these settings should be made only by experienced users or in consultation with ai-quanton GmbH.
Operating SQA1 with SprayQuantAI® Monitor
The video below demonstrates SQA1 operation, from the measurement setup and processing unit to the live display in SprayQuantAI® Monitor.
The basic measurement workflow is:
- Connect the Windows computer and processing unit via Ethernet.
- Enter the processing unit’s IP address in the Device menu and test the connection.
- Select the configuration file and the location for the measurement data.
- Start the measurement and observe the live graphs.
- Save the measurement data to the selected CSV file.
- Stop the measurement before changing settings or loading another configuration file.
Starting a measurement also activates the laser. All required laser safety measures must be in place before measurement begins. Follow the operating manual for the complete safety and shutdown procedures.
Measurement Data and CSV Export
SprayQuantAI® Monitor stores measurement data in CSV format. The file contains:
- date
- time
- mean droplet size
- mean droplet velocity
- number of droplets within the integration time
During continuous measurement, new values are appended to the selected file.